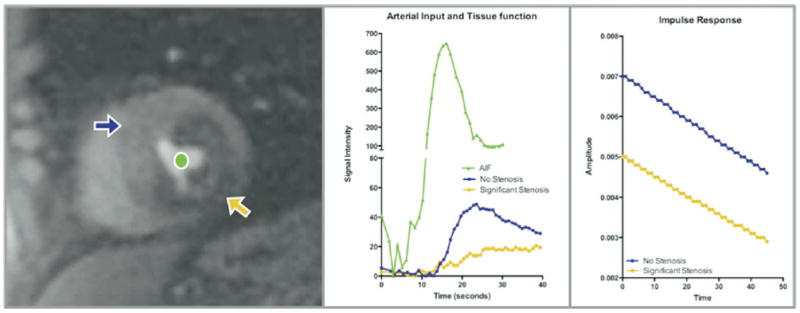
Figure 2.

Left, Short-axis slice of left ventricle, shown at peak enhancement during first-pass perfusion imaging. The orange arrow points to a large perfusion defect in the inferolateral wall, which is visually apparent, and the purple arrow points to a region with normal perfusion. The green circle is in the left ventricular cavity. Middle, Time-intensity curves generated as gadolinium traverses the left ventricular cavity and the normal and abnormal myocardial segments. By deconvolution of the tissue function (purple and orange curves) from the AIF (green curve), an impulse response is generated (right). The initial amplitude of the impulse response (which is a measure of myocardial blood flow) is much higher for the normal (purple) sector than for the abnormal (orange) sector.
