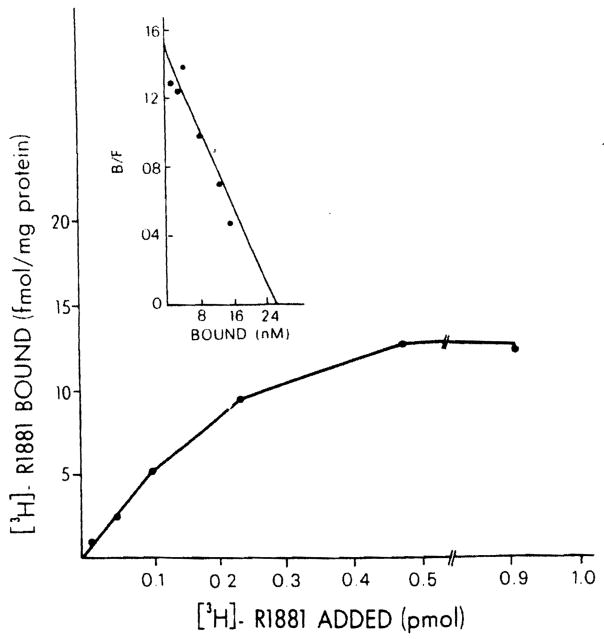
Figure 2.
Specific binding of [3H]R1881 in cytosol of the normal male rat. Aliquots (200 μl)of cytosol were incubated with several different concentrations of [3H]R1881 (0.2–4.0 nM) for 18 h at 4°C in the absence (total binding) and presence (nonspecific binding) of 100-fold excess unlabeled R1881. Specific binding was calculated by subtracting nonspecific binding from total binding. Each point is the mean ± SEM of triplicate determinations. In the insert, the Scatchard plot of specific binding is indicated.

