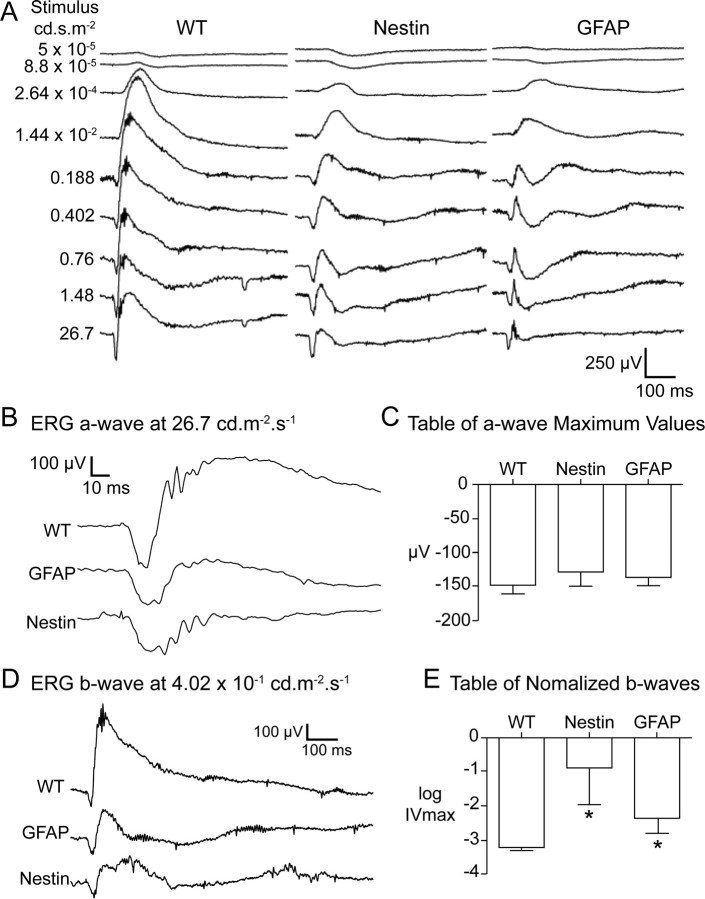
Figure 6.
Full intensity response scotopic electroretinograms. A, Scotopic electroretinograms at varying stimulus intensities from wild-type, Nestin-CRE/DG-null, and GFAP-CRE/DG-null mice (B) Electroretinogram a-wave response at 26.7 cd · s · m−2. C, Maximum a-wave values. D, Electroretinogram b-wave responses at 4.02 cd · s · m−2. E, Normalized b-waves. Note that the Nestin-CRE/DG-null and GFAP-CRE/DG-null mice exhibited robust a-waves but attenuated b-waves.

