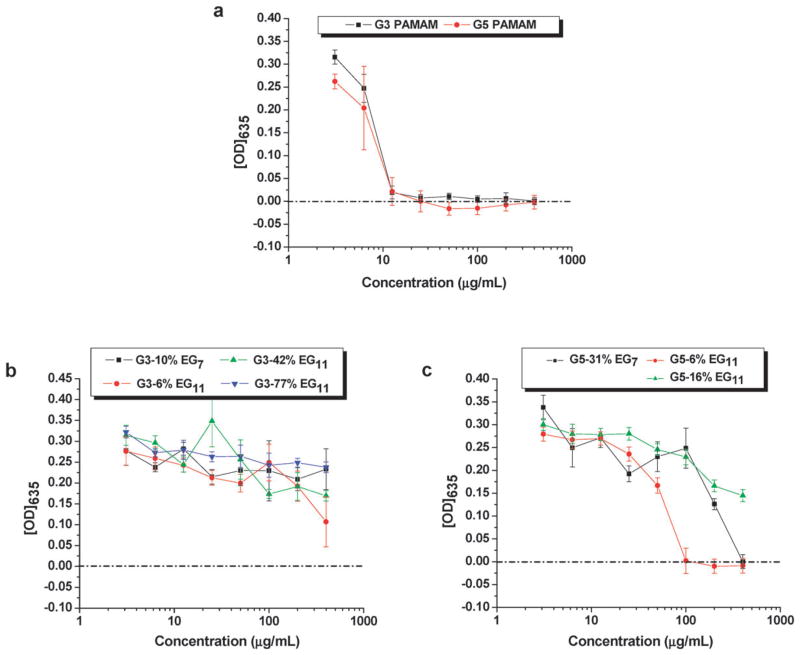
Fig. 3.
Plots of the optical densities at 635 nm vs. concentrations of unmodified PAMAM dendrimers (a), and PEGylated G3 (b) and G5 (c) PAMAM dendrimers in Difco’s nutrient broth after incubation with S. aureus ATCC 29 213 for 18–24 hours. The data in each plot were obtained from a representative experiment where each data point corresponds to a mean of three replicates ± standard deviation.

