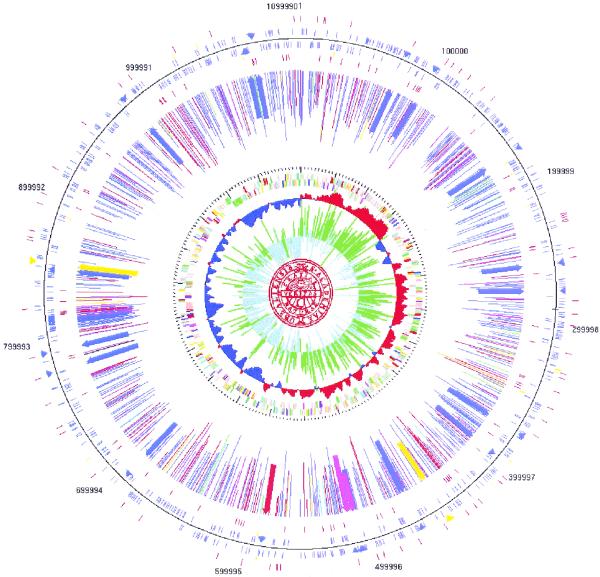
Figure 1.
The phylome map of R.prowazekii (25). The outer circles represent the best hits obtained in searches against public databases using the program BLAST (12). The inner circles represent the phylogenetic connections inferred from phylogenetic reconstructions using the neighbour joining algorithm (20) and the program PAUP* (19). The lengths of the lines in the inner circle are proportional to the number of taxa in the phylogenetic trees. The key to the colour coding system is shown in Figure 2. The thick arrows in the R.prowazekii phylome map show the location of the aminoacyl-tRNA synthetases.

