
Fig. 3.
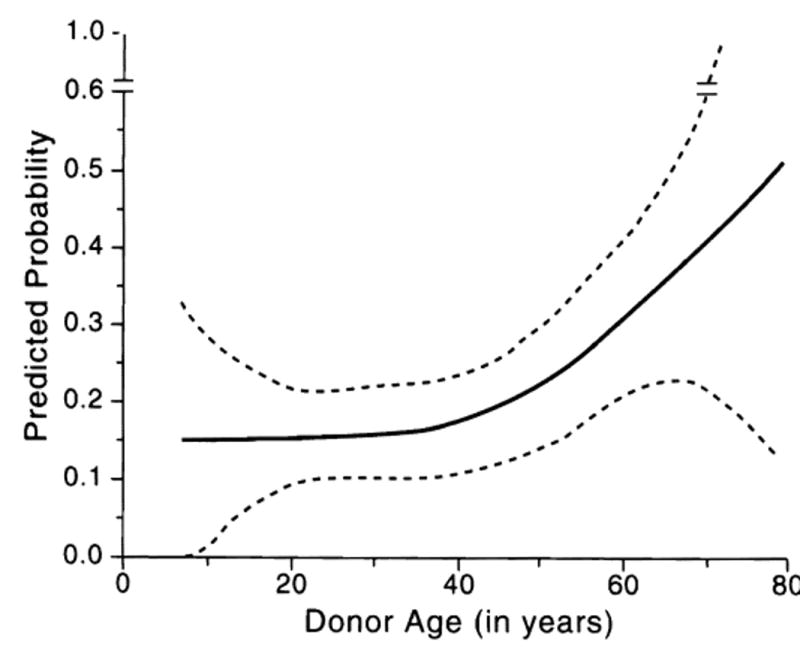
Expected probability of graft failure as a function of donor age (solid line). This assumes that the organs come from male donors, the recipients are not UNOS 4, and it is not a retransplantation. The dashed lines indicate 2 standard errors around the estimated values (thereby closely approximating a continuous 95% confidence band).