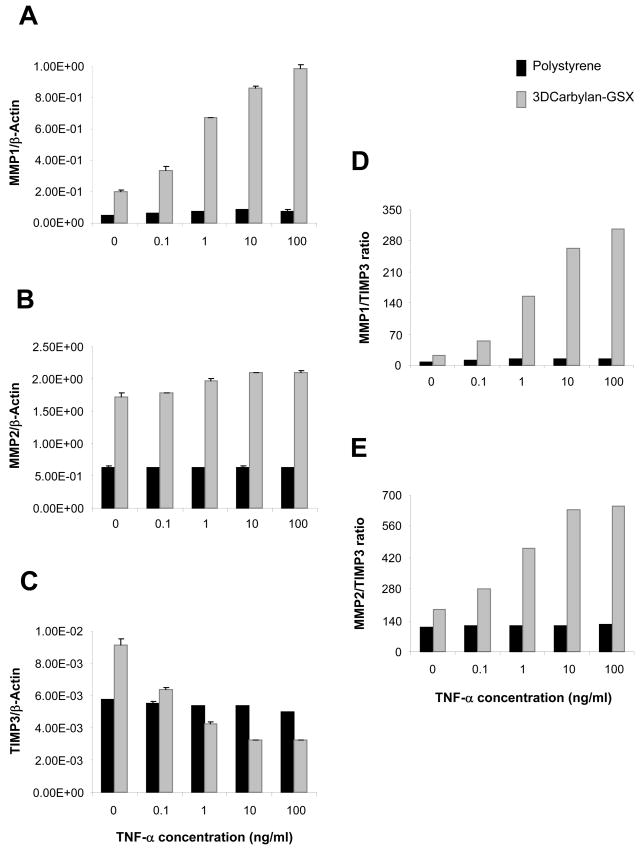
Figure 4.
hVFF mRNA levels for MMP1, MMP2, TIMP3 and MMPs/TIMP3 ratio on polystyrene and in Carbylan-GSX after treated with TNF-α (0.1 to 100ng/ml) in DMEM-10%FBS medium. Y axis is target gene (mRNA concentration ng/μl) normalized by the housekeeping gene, β-Actin (ng/μl); x axis is the TNF-α concentration. (A) MMP1 mRNA level; (B) MMP2 mRNA level; (C) TIMP3 mRNA level; (D) MMP1 to TIMP3 ratio; (E) MMP2 to TIMP3 ratio.

