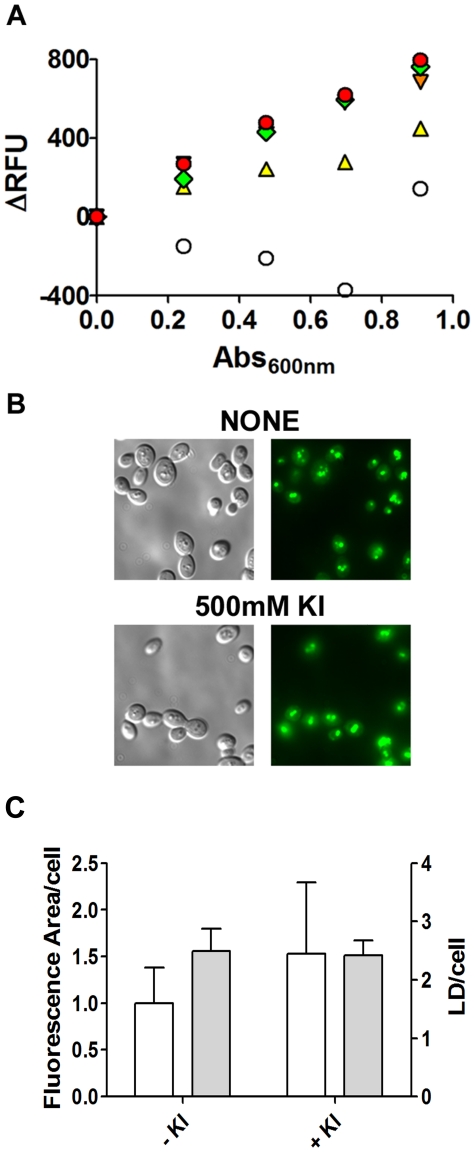
Figure 3. The BODIPY fluorescence signal quenched by iodide is recovered by the addition of cells to the medium.
A. Increasing amounts of formaldehyde-fixed cells were added (subsequent 5 µl additions) to a 96-well plate containing 200 µl of 5 µM BODIPY in the presence of none (○), 0.1 M (▴, yellow), 0.25 M (▾, orange), 0.50 M (♦, green) or 1 M (•, red) KI. Fluorescence intensity (ex/em = 485/510 nm) and absorbance (600 nm) were recorded. A representative experiment is shown. B. Cells grown in YPD to stationary phase were formaldehyde-fixed, washed and resuspended to 10 DO 600 nm/ml. An aliquot of 5 µl of cells was mixed with 5 µl BODIPY solution (10 µM) in the absence (upper panel) or presence of 500 mM KI (lower panel). Stained cells were analyzed by fluorescence microscopy (100x magnification). C. Microscopy images were analyzed. The total fluorescence area/cell was determined and expressed in pixels/cell (white bars). LDs per cell were quantified using the same images (gray bars). Data are for at least 50 individual cells. No statistical difference was found between data collected from images stained with 5 µM Bodipy with or without 500 mM KI.

