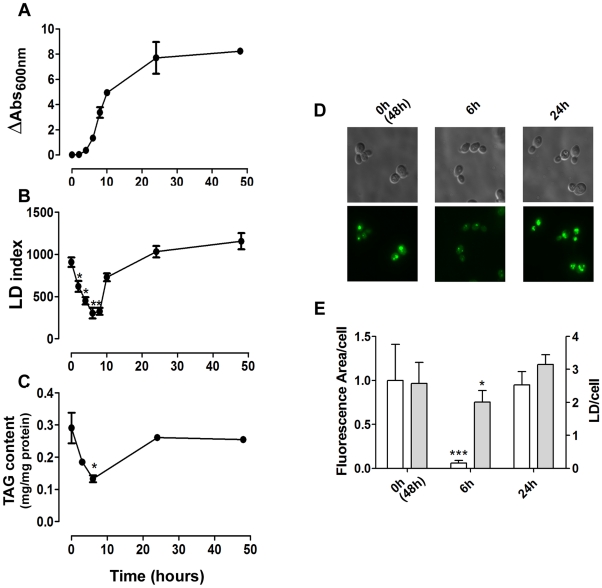
Figure 4. The liquid fluorescence recovery (LFR) assay can detect LD dynamics.
A. Stationary yeast cells pre-grown for 48 hours, were inoculated into fresh YPD medium and cellular growth was recorded by measuring absorbance at 600 nm over the course of 48 hours (n = 3± S.D.). B. Aliquots of cells were withdrawn during growth and fixed in formaldehyde. The LD index was determined (fluorescence/OD cells) using the LFR assay (n = 3± S.D.) C. The triacylglycerol content was measured during growth. D and E. LD content was determined by fluorescence microscopy. Cells were grown for 0 (corresponding to 48 h pre-grown cells), 6 and 24 hours in YPD, incubated with BODIPY and photographed by fluorescence microscopy. The total fluorescence area/cell (white bars) were determined and expressed in pixels/cell (white bars). LDs per cell were quantified using the same images (gray bars). Data are for at least 50 individual cells. *p<0.05, ** p<0.01, ***p<0.001, in comparison to WT values.

