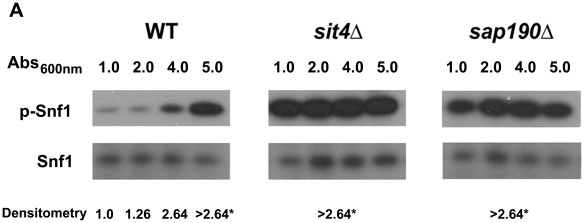
Figure 8. Snf1 kinase phosphorylation levels during growth.
WT, sit4 and sap190 cells were grown in YPD at 30°C while shaking. Aliquots of the culture were harvested at different times during growth (OD 600 nm of 1, 2, 4 or 5), and protein was extracted using the rapid NaOH extraction method [31]. SDS-PAGE gels were loaded with 0.1 OD 600 nm cells per well. Snf1 phosphorylation was analyzed by western blot using anti-phospho AMPKα antibody (P-SNF1, upper panel). As a control for loading, total Snf1 was revealed with anti-SNF1 antibody (lower panel). For autoradiography the films were exposed for the minimum time necessary to detect the phosphorylation signal for WT grown to OD 1.0 which was used as reference. The numbers below the figure represent the densitometry analysis of the P-SNF1/SNF1 ratio (n = 3). Signals were linear unless marked by*.

