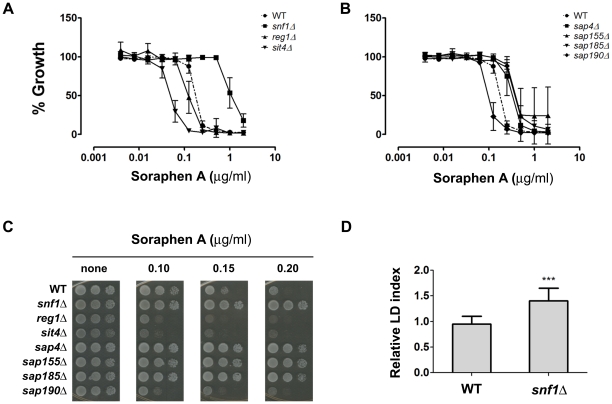
Figure 9. Soraphen A resistance profiles.
Soraphen A resistance was determined by the microtiter assay and the spot assay. A and B. Serial dilutions of soraphen A were used for the indicated strains (n = 3± S.D.) IC50 were estimated (wt = 0.19, snf1 = 0.95, reg1 = 0.11, sit4 = 0.05, sap4 = 0.36, sap155 = 0.38, sap185 = 0.38 and sap190 = 0.1 µg/ml). C. For the spot assay, serial dilutions (107, 106 and 105 cells/mL, from left to right) of a cellular suspension were seeded onto plates containing YPD solid medium in the presence of increasing concentrations of soraphen A and incubated at 30°C for two days. D. Relative LD index of snf1 cells from a stationary culture in YPD medium was determined by LFR assay, as described. (n = 3,± S.D.) (***p<0.001).

