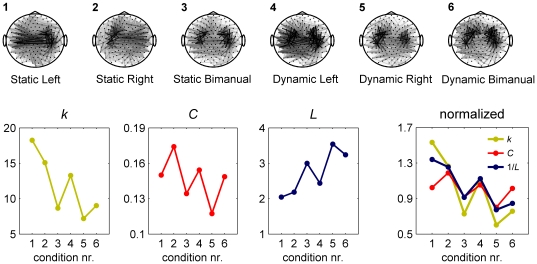
Figure 1. Differences in average degree between empirical networks may influence graph measures.
The data here are taken from an MEG experiment we conducted in which participants performed a precision grip force in six experimental conditions that differed in the force pattern exerted (static or dynamic) and hand used (left, right, or bimanual). The topographies show the relative phase uniformity (15–30Hz) between all MEG sensor combinations that is increased compared to resting state. The gray scale indicates the connectivity strength, with stronger connections in darker colors. Results are averaged over 3×40s steady state force production and 20 participants. Lower panels: although the clustering coefficient (C) and path length (L) show clear differences between conditions, these effects co-vary with differences in average degree (k). This can be seen more clearly in the right plot where values are divided by the average for each measure and L is inverted. It is difficult to disentangle true experimental effects from those introduced by differences in k because the exact dependence of C and L on k is unknown.

