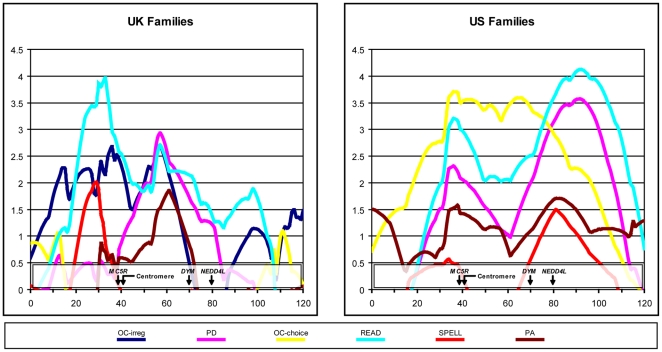
Figure 1. DF linkage analysis on chromosome 18 of the UK and US families.
Families were selected for each quantitative trait if any sibling scored >1.5 SD or >2 SD below the normative mean for that trait, for the UK or US families, respectively. The units of the x-axis are cM and y-axis are negative t-scores.

