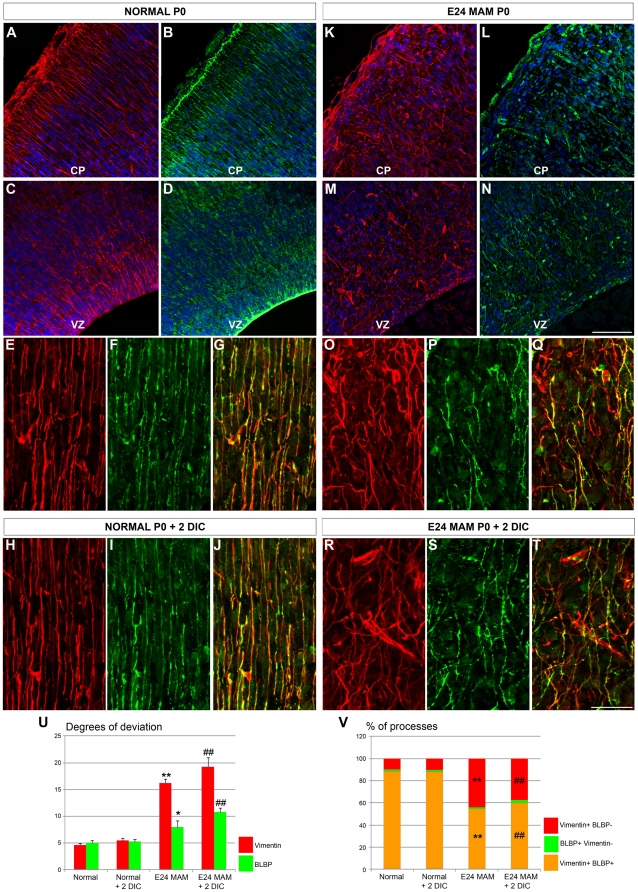
Figure 3. Morphology and phenotype of radial glial cells in normal and E24 MAM treated ferrets.
Vimentin (red) and BLBP (green) immunostaining on coronal cortical sections cut on a cryostat (A–N) and organotypic slices maintained 2 DIC in vitro (O–T). Nuclear staining in blue with bisbenzimide. In normal ferrets, vimentin and BLBP expression is observed at the pial surface (A–B), in the ventricular zone (VZ) (C–D) and in elongated radial glial fibers in the cortical plate (CP) (E–F). Both markers colocolize as seen in the merged image (G). The same pattern of expression was maintained when normal slices were cultured for 2 days in vitro (H–J). In E24 MAM treated ferrets, the radial glial scaffold is severely disrupted (K–Q) and fewer vimentin-positive radial glial processes also express BLBP as seen in the merged picture (Q). Radial glial misalignment and BLBP downregulation were also observed in E24 MAM treated organotypic slices after 2 days in vitro (R–T). (U) is a graph of the degrees of deviation in radial glia. In normal ferrets (n = 6; 2 E38, 2 E39 and 2 P0), the low degree of deviation for vimentin+ and BLBP+ processes indicates that radial glia were relatively parallel. Similar results were obtained with normal ferrets slices maintained 2 days in culture (DIC) (n = 8; P0+2 DIC). The disrupted radial glial scaffold in MAM treated ferrets in vivo (n = 5; 3 E39 and 2 P0) and after 2 days in vitro (n = 6; P0+2 DIC) is illustrated by a large degree of deviation for vimentin+ processes. Although the lower degree of deviation for BLBP indicates that BLBP+ radial glia are only mildly disrupted compared with the vimentin+ cells in the MAM treated slices, they were significantly disrupted compared to BLBP+ cells in normal ferrets. (V) Histogram of the percentage of processes expressing vimentin and BLBP (vim+BLBP+, orange), only vimentin (vim+BLBP-, red) or only BLPB (BLBP+vim-, green). CP: Cortical Plate; VZ: Ventricular Zone. n = number of slices; one slice/animal was analyzed. Error bars = standard error. Significance was determined using a Two-way ANOVA followed by pairwise multiple comparison procedures (Holm-Sidak method). *p = 0.013, **p≤0.001 compared to normal ferret; # = 0.001 compared to normal ferret +2 DIC. No statistical differences were found when we compared (i) normal ferrets vs normal ferrets +2 DIC and (ii) E24 MAM ferrets vs E24 MAM ferrets +2 DIC. Scale Bar: 25 µm.

