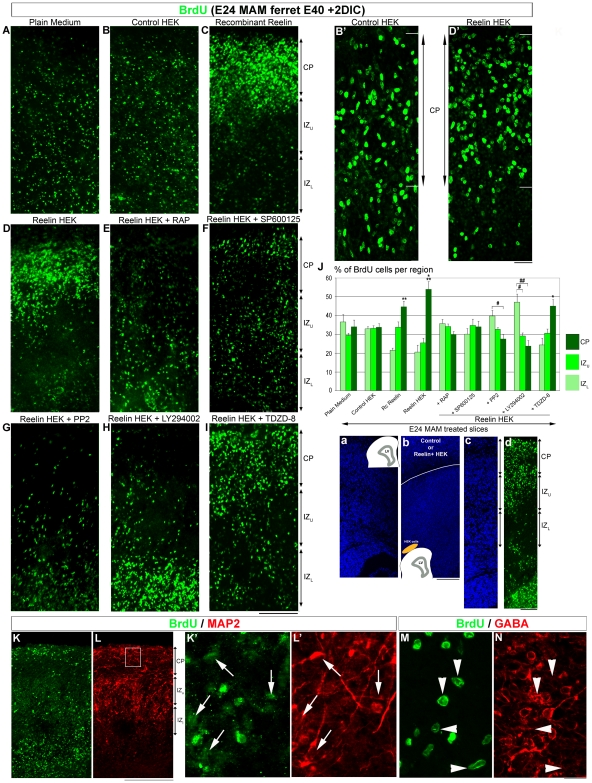
Figure 5. Position of BrdU+ cells in E24 MAM treated organotypic cultures exposed to reelin.
In the middle right of the figure (a–b) are bisbenzimide stained images of organotypic cultures maintained under different conditions. In each image is a diagram of the slice and associated coculture with HEK cells. (c–d) show the zones analyzed for the position of BrdU+ cells after 2 days in culture (DIC) (c) is bisbenzimide staining and (d) is BrdU immunostaining after coculture with reelin+ HEK cells. After a pulse of BrdU, MAM treated slices were incubated for 2 DIC in plain medium (A, n = 6) as shown in (a), or cocultured with control HEK cells (B, n = 8) as seen in (b); HEK cells included in Matrigel and placed at the pial surface are shown in yellow (b). Some slices were incubated with recombinant reelin (C, n = 8) or cocultured with reelin secreting HEK cells (D, n = 6 as shown in [b]). To inhibit specific steps of the reelin pathway, other slices were cocultured with HEK cells secreting reelin in a medium supplemented with 300 nM RAP (E, n = 8), 10 µM SP600125 (F, n = 11), 10 µM PP2 (G, n = 5), 50 µM LY294002 (H, n = 6), or 56 µM TDZD-8 (I, n = 5). (See Figure S1). (B') shows a high magnification of BrdU+ cells in the cortical plate (CP) in slices cocultured with control HEK cells while (D') shows an image of BrdU immunoreactivity in an organotypic slice cultured with reelin+ HEK cells. (J) is a histogram indicating the distribution of BrdU+ cells after different treatments. (K–N) Organotypic MAM treated slice (E40) incubated 2 DIC with recombinant reelin (1nM), resectioned using a cryostat at 14 µM. Double immunostaining for BrdU (K, green) and MAP2 (L, red). (K'–L') Higher magnification of the boxed area in L. The arrows indicate BrdU-positive cells that are also MAP2-positive. Double immunostaining for BrdU (M, green) and GABA (N, red). The arrow heads indicate BrdU+ cells that are GABA-negative. CP: Cortical Plate; IZu-L: Upper and Lower Intermediate Zone. n = number of slices. Error bars = standard error. Significance was determined using a Two-way ANOVA followed by pairwise multiple comparison procedures (Holm-Sidak method). *p = 0.017, **p = 0.003, ***p = 0.001 compared to CP in control medium. #p = 0.017, ##p = 0.025 compared to IZL. Scale Bar: 50 µm (A–I), 25 µm (K',L',M,N), 250 µm (K–L), and 500 µm (a–d).

