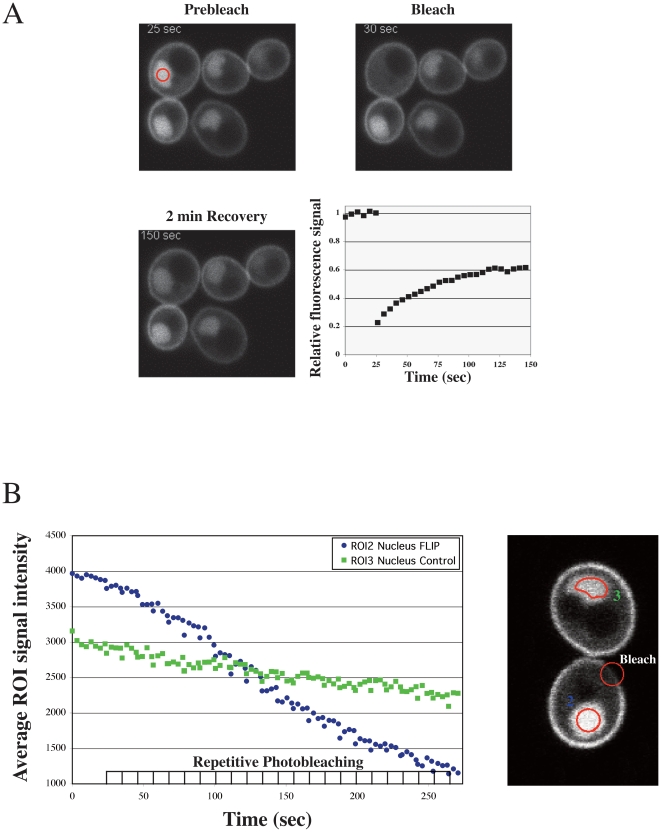
Figure 5. Rac1 cycles in and out of the nucleus.
(A) FRAP analysis of nuclear Rac1. Confocal microscopy images of budding rac1Δ/rac1Δ PADH1GFPRAC1 (PY205) cells, after 1 h in the absence of agitation, were taken prior to and subsequent to photobleaching of the nucleus. A typical nuclear fluorescence recovery after photobleaching experiment is shown. (B) FLIP analysis of nuclear Rac1. Confocal microscopy images of budding PY205 cells, after 1 h in the absence of agitation, were taken subsequent to photobleaching a region on the plasma membrane (Bleach). For fluorescence loss in photobleaching experiments, images of the nucleus of the photobleached cell (ROI2 nucleus FLIP) together with images of the nucleus of an adjacent cell (ROI3 nucleus control) were captured every 4 sec. Plasma membrane photobleaching was repeated after every 4 images.

