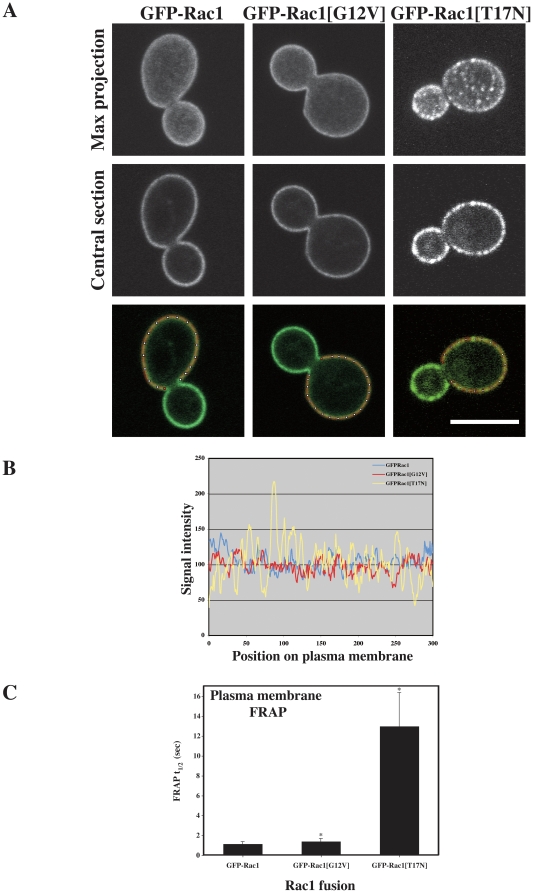
Figure 6. Rac1 dynamics at the plasma membrane depend on its activation state.
(A) Localization of Rac1, activated (Rac1[G12V]) or inactivated (Rac[T17N]) forms. Confocal microscopy images of budding rac1Δ/rac1Δ PADH1GFPRAC1 (PY205), rac1Δ/rac1Δ PADH1GFPrac1[G12V] (PY209), and rac1Δ/rac1Δ PADH1GFPrac1[T17N] (PY212) cells were taken; both the maximal projection and central section are shown. (B) Inactivated and activated forms of Rac1 have different plasma membrane distributions. Graph of signal intensity along plasma membrane perimeter of the indicated cells, as shown in the bottom panel of Figure 6A. (C) FRAP analysis of cells expressing Rac1 (n = 17), its activated (Rac1[G12V]) (n = 20) or inactivated (Rac[T17N]) (n = 17) forms. FRAP t½ values (means ± standard deviation) are determined from single-phase exponential curve fit of fluorescence recovery after photobleaching. The two-tailed P-values of the indicated mean FRAP t½'s (*) are less than 0.006 compared with the FRAP t½ of GFP-Rac1.

