Figure 3.
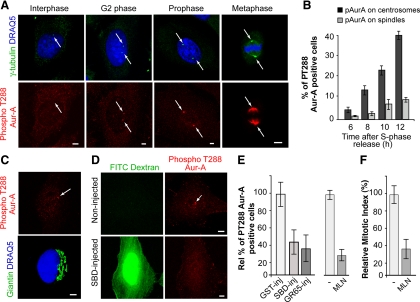
Inhibition of Golgi fragmentation blocks Aur-A activation at the centrosomes in HeLa cells. Cells were grown on coverslips and processed for immunofluorescence under confocal microscopy after the S phase block release. (A) Representative images of cells at the indicated cell cycle stages, labeled with antibodies against γ-tubulin (green, arrow), and with DRAQ5 (blue) for cell cycle phase (top), and labeled with antibodies against T288-phosphorylated Aur-A (red, arrow; bottom). (B) Quantification of cells as described in A, with pT288-Aur-A–positive cells calculated as percentages of cells with active T288-phosphorylated Aur-A at the centrosome (dark gray bars) and the spindle (light gray bars), at the indicated times. (C) Representative images of cells 8 h after thymidine washout, labeled with antibodies against T288-phosphorylated Aur-A (red, arrow), and labeled with antibodies against giantin (green) for the Golgi complex, and with DRAQ5 (blue) for cell cycle phase. (D–F) The cells were either nonmicroinjected or microinjected 1 h after thymidine washout, with recombinant GST (GST-inj; 8 mg/ml), recombinant SBD (SBD-inj; 8–12 mg/ml), or recombinant GRASP65 (GR65-inj; 8–10 mg/ml), and with FITC-conjugated dextran as microinjection marker. For the noninjected cells, 8 h after the S phase block release they were treated with vehicle (−) or 0.25 μM MLN8054 (MLN). The cells were then processed 12 h after the S phase block release for immunofluorescence under confocal microscopy with antibodies against T288-phosphorylated Aur-A and with DRAQ5 (for cell cycle phase). (D) Representative images of noninjected and SBD-injected cells. (E) The relative percentages of PT288 Aur-A–positive cells were calculated according to the relevant nonmicroinjected cells on the same coverslip (see Materials and Methods) or to cells treated with vehicle (−). (F) Quantification of the mitotic index of cells treated with MLN. All images were acquired at maximal resolution, with fixed imaging conditions. Quantification data are means ± SD from two (B and F) and four (E) independent experiments, each carried out in duplicate. More than 200 cells were microinjected for each condition. Bar, 5 μm.

