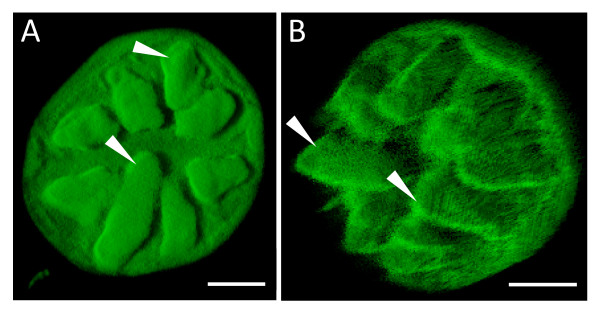
Figure 6.
Three-dimensional images of isolated A. officinalis salt gland. Top view (A) and side view (B) of the same salt gland showing 8 secretory cells (arrows). Optical sections were first taken using Zeiss LSM 510. Excitation and emission wavelengths were 488 nm (12%) and >505 nm, respectively. Each three-dimensional image was constructed from the stacked images using Imaris™ (beta) 3.0. Bars = 10 μm.

