
Table 1.
IC50 Values of Substituted Indole Inhibitors against Human and Mouse sPLA2sa
 | ||||||||||||||||
|---|---|---|---|---|---|---|---|---|---|---|---|---|---|---|---|---|
| IC50(nM) | ||||||||||||||||
| comp | R1 | R2 | hGIB | mGIB | hGIIA | mGIIA | hGIIDc | mGIID | hGIIE | mGIIE | hGIIF | mGIIF | hGV | mGV | hGX | mGX |
| 1b | 750±150 | 140±75 | 125±20 | 70±20 | 60±10 | 430±90 | 50±20 | 75±20 | 130±30 | >1600 | 500±50 | 750±100 | 75±10 | 75±10 | ||
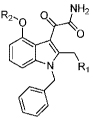
| 11c |  |
>1600 | 950±80 | 250±20 | 60±10 | 170±30 | 890±45 | 7±1 | 12±2 | 1100±60 | >1600 | 100±20 | 60±7 | 15±3 | 30±7 | |
| 11d |  |
>1600 | >1600 | >1600 | >1600 | 700±230 | >1600 | >1600 | >1600 | >1600 | >1600 | >1600 | >1600 | 21±7 | >1600 | |
| 12a |  |
80±20 | 100±30 | 170±40 | 60±10 | 120±40 | >1600 | 9±4 | 140±50 | 90±30 | 470±190 | 44±9 | 57±20 | 22±2 | 20±5 | |
| 12b | >1600 | 580±10 | >1600 | >1600 | 500±90 | >1600 | 1300±18 | >1600 | 550±100 | >1600 | >1600 | >1600 | 50±16 | >1600 | ||
a
IC50 values are reported as the mean of duplicate or triplicate analysis with standard deviations. Each compound was screened at 1660 nM and reported as >1600 nM if the inhibition was <50%.
b
IC50 values for GIB, GIIA, GIIE, GV, and GX from ref 17. Retest of this compound against hGV and mGV gave 110 ± 30 and 160 ± 20 nM, respectively.
c
IC50 values obtained using E. coli membrane assay. Each compound was screened at 1330 nM and reported as >1300 nM if the inhibition was <50%.