
Table 4.
IC50 Values of Substituted Indolizine Inhibitors against Human and Mouse sPLA2sa
 | ||||||||||||||||
|---|---|---|---|---|---|---|---|---|---|---|---|---|---|---|---|---|
| IC50 (nm) | ||||||||||||||||
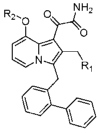
| comp | R1 | R2 | hGIB | mGIB | hGIIA | mGIIA | hGIIDb | mGIID | hGIIE | mGIIE | hGIIF | mGIIF | hGV | mGV | hGX | mGX |
| Indoxam | 700±30 | 1000±60 | 60±10 | 150±40 | >1300 | >1600 | 10±2 | 35±15 | >1600 | >1600 | 100±5 | 170±10 | >1600 | 900±300 | ||
| 16a | >1600 | >1600 | >1600 | >1600 | >1300 | >1600 | >1600 | >1600 | 970±50 | 1100±200 | >1600 | >1600 | >1600 | >1600 | ||
| 16b | >1600 | 1200±110 | 30±10 | >1600 | >1300 | >1600 | 90±15 | 410±20 | >1600 | >1600 | >1600 | >1600 | >1600 | >1600 | ||
| 16c | >1600 | 320±20 | 35±2 | >1600 | >1300 | >1600 | 50±10 | 230±110 | >1600 | >1600 | >1600 | >1600 | >1600 | >1600 | ||
a
IC50 values are reported as the mean of duplicate or triplicate analysis with standard deviations. Each compound was screened at 1660 nM and reported as >1600 nM if the inhibition was <50%.
b
IC50 values obtained using E. coli membrane assay. Each compound was screened at 1330 nM and reported as >1300 nM if the inhibition was <50%.