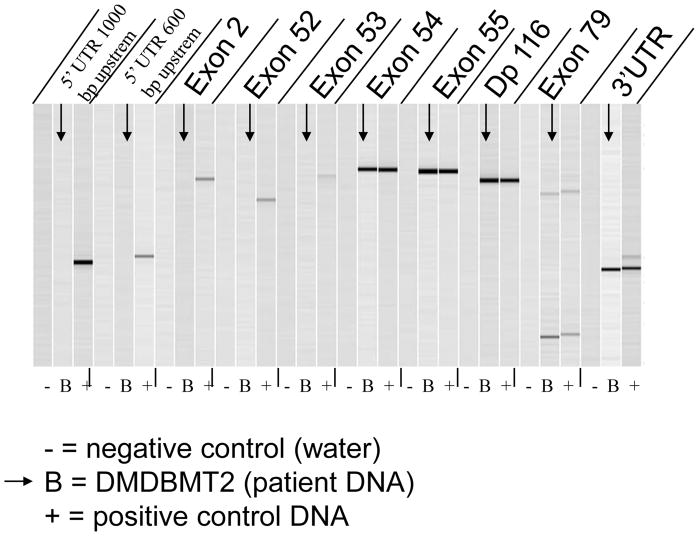
Figure 1.
Capillary electrophoresis image of PCR amplification products using dystrophin primers. No PCR products are observed between exons 1 and 53 of dystrophin in DNA obtained from the patient’s skin fibroblasts prior to transplantation, while normal exon products are observed from exon 54 through exon 79. N, negative control; B, patient; P, positive control.

