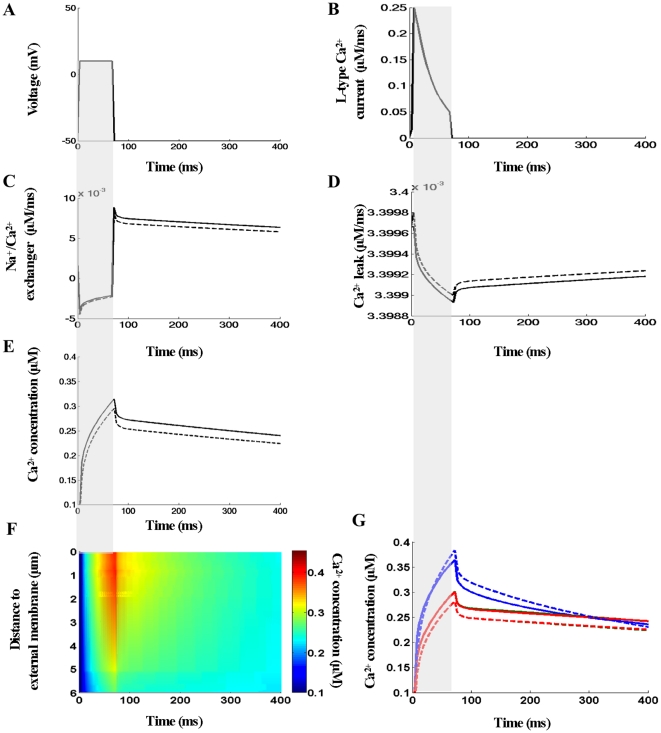
Figure 7. Effects of ATP and camodulin mobility on subcellular [Ca2+]i signals.
(A–B) The voltage-clamp protocol and whole-cell L-type Ca2+ current. (C–E) Quantitative comparison of the effects of buffer mobility on the global Na+/Ca2+ and Ca2+ leak currents and global Ca2+ transient (solid lines - CaATP and CaCal mobile, dashed lines - CaATP and CaCal stationary). (F) Line-scan image with CaATP and CaCal immobilized. (G) Quantitative comparison of the effects of buffer mobility on the local Ca2+ transients. During this numerical experiment Fluo-3 was zero, Ca2+ fluxes heterogeneously distributed via the sarcolemma, line-scan positioned at 200nm away from the t-tubule membrane at the angle 120°. Along the scanning line the featured spots were chosen to be the same as in Fig. 6G.

