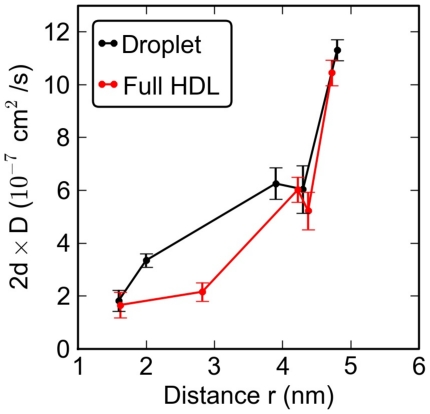
Figure 6. Diffusion coefficients of the lipid components.
Each point in the plot describes the diffusion coefficient for one of the lipid types. The distance  is the average distance of the given lipid from the COM of the particle. To facilitate comparison between core (three-dimensional diffusion) and surface lipids (two-dimensional diffusion), the coefficients have been scaled with
  , where
  is the dimension of the fit (either two or three).

