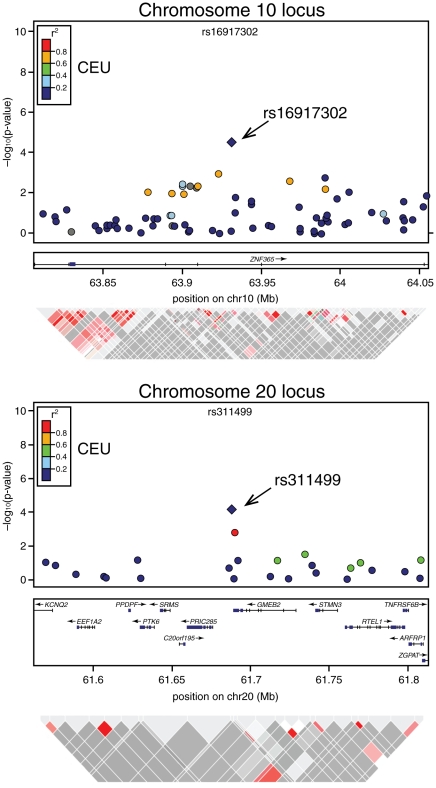
Figure 1. Association signals, genetic structure, and linkage disequilibrium of the novel modifier loci of BRCA2 penetrance in the regions surrounding rs1691730 on chromosome 10 and rs311499 on chromosome 20.
The color of the dots indicates linkage disequilibrium (LD; based on r2 values) in the CEU population (as per scale). Triangle plots below represent LD from actual data of BRCA2 carries in the study.

