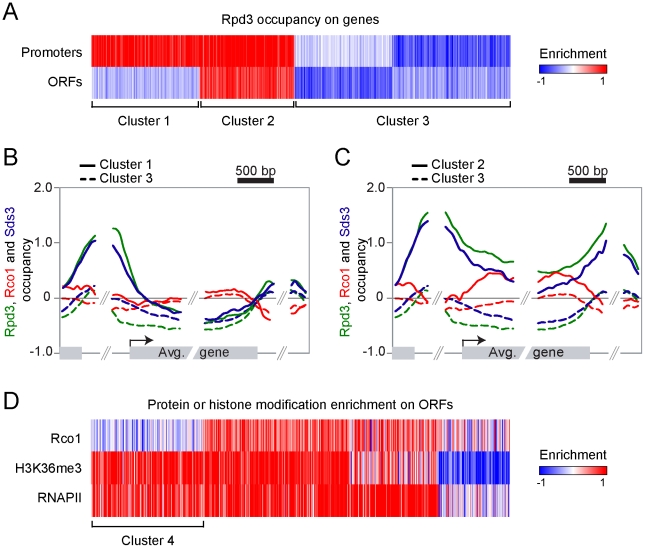
Figure 1. Rpd3S and Rpd3L target overlapping sets of genes.
(A) Self-organizing map (SOM) clustering of Rpd3 binding on promoter and ORFs of the 3693 genes with no missing value. Red indicates enriched (bound) regions and blue represents depleted regions. (B,C) Mapping of Rpd3 (green), Rco1 (red) and Sds3 (blue) on the 954 genes from cluster 1 (solid line, genes where Rpd3 is present both on ORFs and promoters) and on the 1906 genes from cluster 3 (dashed lines, genes where Rpd3 is not bound) (B) and on the 833 genes from cluster 2 (solid lines, genes where Rpd3 is present only on promoters) and cluster 3 (C). (D) SOM clustering of Rco1, H3K36me3 and RNAPII on genes from the cluster 2 from panel “A”. Cluster 4 represents the 222 active genes with no Rco1 binding.

