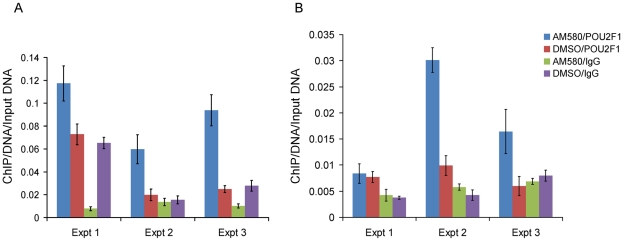
Figure 5. Enrichment of the region spanning rs11868112 in Anti-POU2F1 ChIPed DNA relative to rabbit IgG ChIPed after AM580 and DMSO treatment.
In HepG2 (A) and MCF-7 (B). Each bar indicates the average of three real time PCR technical replicates normalized by the input DNA and the error bar denotes standard deviation.

