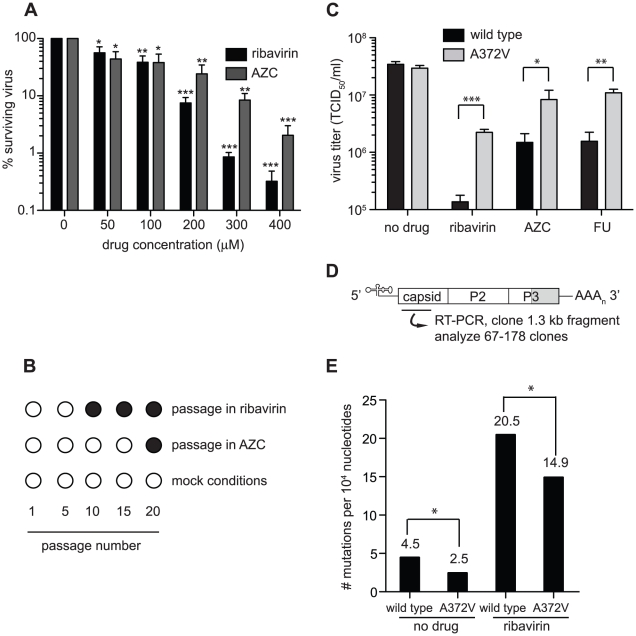
Figure 1. Isolation of an RNA mutagen resistant CVB3 with a high fidelity RdRp.
(A) Optimization of the RNA mutagen treatment concentrations to select for resistant CVB3 variants. HeLa cells, treated with different concentrations of either ribavirin or AZC were infected with wild type CVB3 at MOI of 0.01. 48 hours after infection, progeny virus was quantified by TCID50 assay. The percentage of viruses surviving treatment (y-axis) with 50, 100, 200, 300 or 400 µM of ribavirin or AZC (x-axis) was determined by dividing the virus titers of treated populations by virus titers in untreated controls (0 µM). Mean values ± S.E.M are shown, N = 4, * P<0.01, ** P<0.001, ***P<0.0001. (B) Isolation of RNA mutagen resistant CVB3. CVB3 was passaged 20 times in 50 µM ribavirin, 50 µM AZC or mock treated HeLa cells. Every 5 passages the virus population was sequenced. The emergence of a single point mutation resulting in a A372V change in the RdRp is indicated by a solid circle. (C) A372V is resistant to three different base analog RNA mutagens. HeLa cells treated with 300 µM of ribavirin or AZC, or 150 µM FU, were infected with either wild type CVB3 (black bars) or A372V variant (gray bars) at an MOI of 0.01. Control infections (no drug) were also performed. At 48 hours after infection, progeny virus was titered by TCID50 assay. Mean virus titers ± S.E.M are shown, N = 8, * P<0.05, ** P<0.01, *** P<0.001. (D) Schematic of the viral RNA genome showing the 5′ untranslated region, structural capsid coding region, P2 and P3 region of non structural proteins, including the RdRp (shaded gray) and the 3′ untranslated region. A 1.3 kb region of the viral capsid was RT-PCR amplified and subcloned for sequencing of individual clones to obtain the observed mutation frequencies presented throughout this work. The total number of clones and nucleotides sequenced in each population is shown in Table S1. (E) Average mutation frequencies of each viral population shown as the mean number of mutations per 104 nucleotides sequenced. Statistical analysis is described in Methods. * P<0.05 statistical significance of difference between WT and A372V mutation frequencies.

