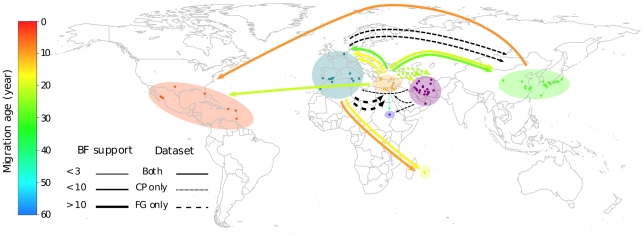
Figure 3. TYLCV migration events inferred using the coat protein (CP) and full genome (FG) datasets.
Sampling locations are indicated using circles that are coloured depending on the discreet sequence groupings they were assigned to during our phylogeography analyses (indicated by transparent coloured areas). Virus movements implied by location state transitions along the branches of the CP (see Figure 2) and FG MCC trees are indicated using arrows. Arrow colours depict the mean ages (in years) of the movements that they represent (inferred using the CP dataset and coloured according to the colour scale on the left of the figure). The thickness of arrows indicating movements between two locations indicate the over-all Bayes factor test support for epidemiological linkage between the locations. Whereas individual migration events inferred with both the CP and FG datasets are represented using solid arrows, events inferred with only the CP or the FG dataset are represented with dotted and dashed lines respectively.

