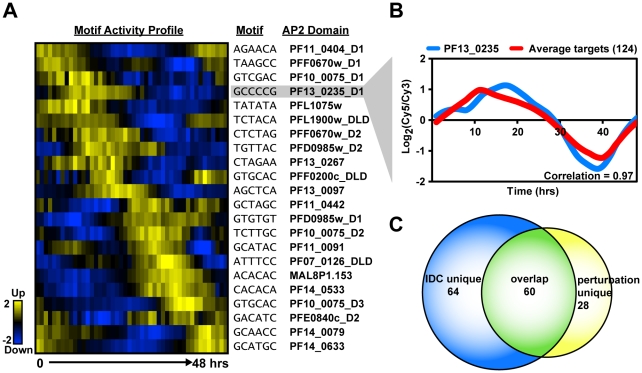
Figure 4. Activity profiles for AP2 motifs and refinement of target gene predictions during the IDC.
A) The heat map shows the motif activity profiles based on mutual information content between the motifs and genes expressed at each timepoint of the IDC. Target genes with expression profiles similar to the activity profiles and containing the motif of interest were identified. B) A plot of the average mRNA abundance for target genes with matches to the G-box motif in their upstream sequences is depicted. This is compared with the relative mRNA abundance data for pf13_0235, the ApiAP2 factor that binds to the G-box. There is a strong positive correlation (0.97) between pf13_0235 expression and the expression of its predicted targets. C) The Venn diagram shows the overlap between IDC co-expressed targets and perturbation co-expressed targets. Half of PF13_0235 targets are shared between both datasets, and include ribosomal and heat shock genes.

