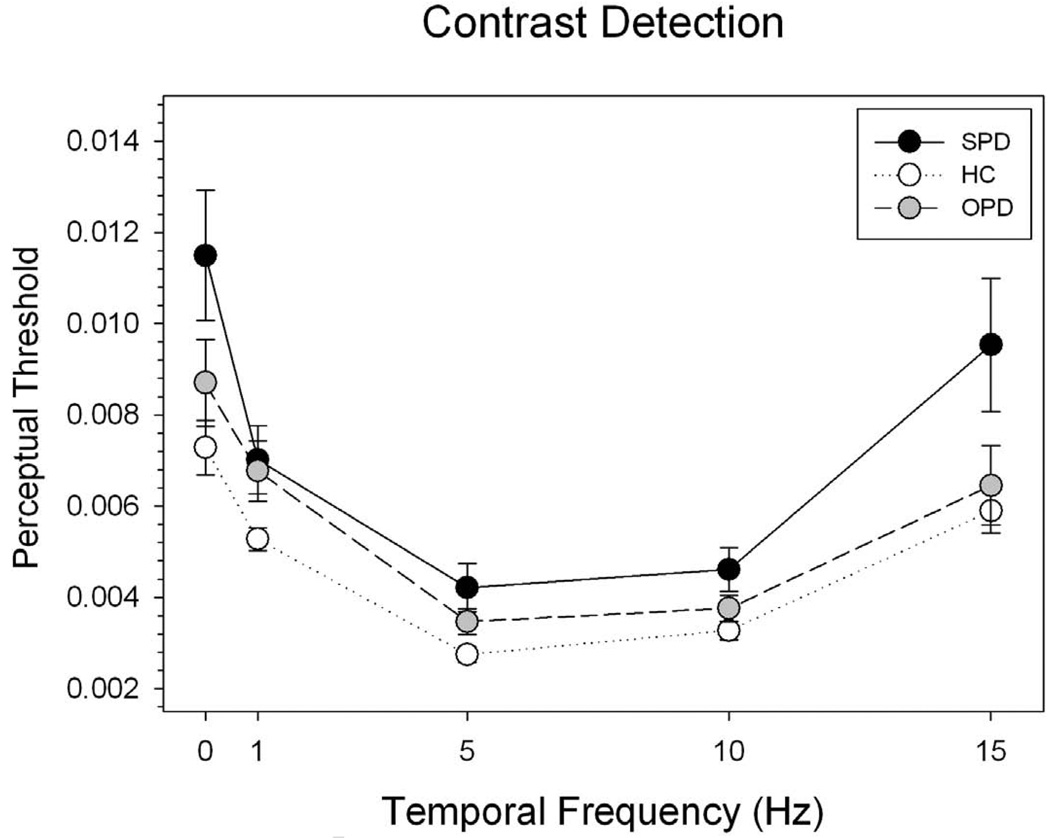
Fig. 1.
Summary of contrast detection thresholds in SPD, HC and OPD groups Perceptual threshold was defined as minimum difference in luminosity between the bars of the sinusoidal grating needed for subjects to perform the task at equivalent 79% accuracy level. The X axis represents temporal frequencies whereas Y axis represents the means of perceptual threshold for each group. The error bars indicate one standard error

