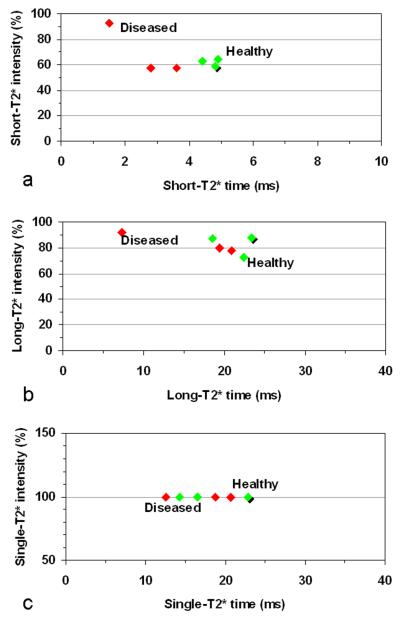
Fig. 4.
A 2D plot of global averages of T2* relaxation time and intensity of the investigated cartilages with three asymptomatic/healthy (green, shadow at HTP-5) and three diseased (red): a) Short-T2* component from multi-component exponential fitting, b) Long-T2* component, and c) Single-component from conventional mono-exponential fitting. The short-T2* component differentiated the diseased cartilages from the asymptomatic ones, while the long-T2* component or single-component did not. The percent intensities are not added up to 100 because they are averages instead of values at individual pixels.

