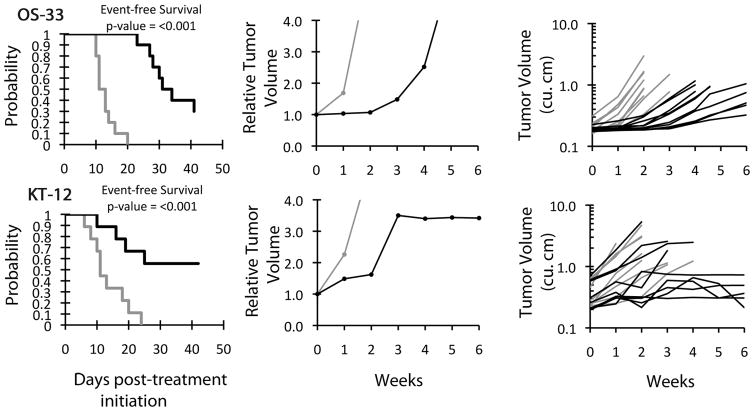
Figure 2.
Plots depicting tumor growth and survival of mice treated with GSK960693 versus controls. Median tumor volume over time (left) and Kaplan-Meier plot of EFS over time (right) for the xenografts OS-33 (A) and KT-12 (B). Gray lines indicate vehicle-treated control mice and black lines indicate GSK690693-treated mice.

