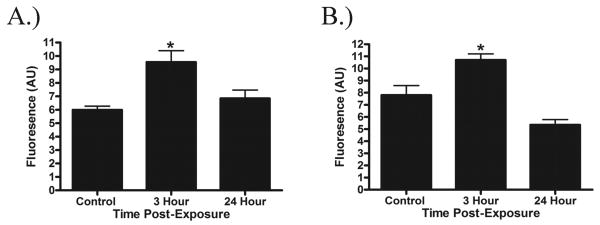
Fig. 5.
Quantification of 4HNE (A) and 3NT (B) levels in brain sections after exposure to blast. Significant increases in 3NT and 4HNE levels were observed at 3 h after exposure compared to control. At 24 h after exposure, 3 NT and 4HNE levels returned to control values. The data represents the mean fluorescence ± SEM. Significance with ANOVA followed by post hoc analysis (SNK) as follows: *p<0.05.

