
Figure 3.
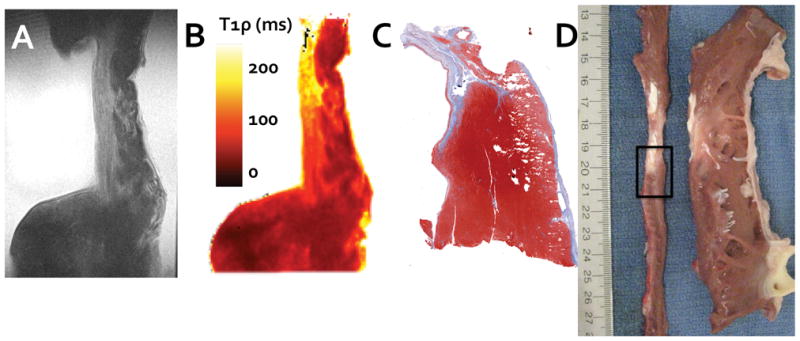
To confirm the T1ρ relaxation time enhancement, tissue was excised from the left ventricular wall and scanned at high resolution. A single T1ρ-weighted image (A, TSL = 48 ms) is shown alongside the corresponding T1ρ relaxation map (B) and shows relaxation time enhancement in the thin region of the left ventricular wall. This relaxation time enhancement corresponds with the collagenous scar identified by trichrome biochemical staining (C) and digital photographs of the same region immediately after sacrifice (D). In (D), the left ventricle has been sliced along the vertical long axis, unwrapped, and sliced again along the short axis (narrow thin strip of tissue on the left). The interface between infarct and borderzone tissue identified for ex vivo imaging is outlined (black rectangle).