
Figure 5.
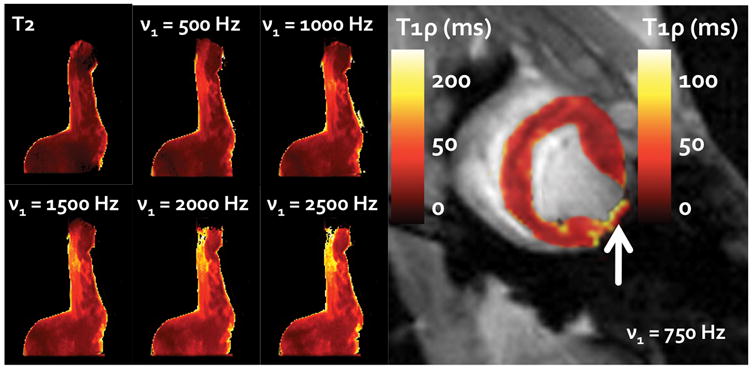
The six images on the left demonstrate the change in relaxation times and relative enhancement of contrast through the use of an increasingly greater RF spin lock field (ν1 = 500–2500 Hz, B0 = 7T). These images are shown alongside a comparable T2 relaxation map of the same slice. A corresponding left ventricular in vivo T1ρ-relaxation map is shown on the right (ν1 = 750 Hz, B0 = 3T). The arrow depicts the infarct area on the free wall. Note that the scales for the ex vivo and in vivo images are different.