
Figure 3.
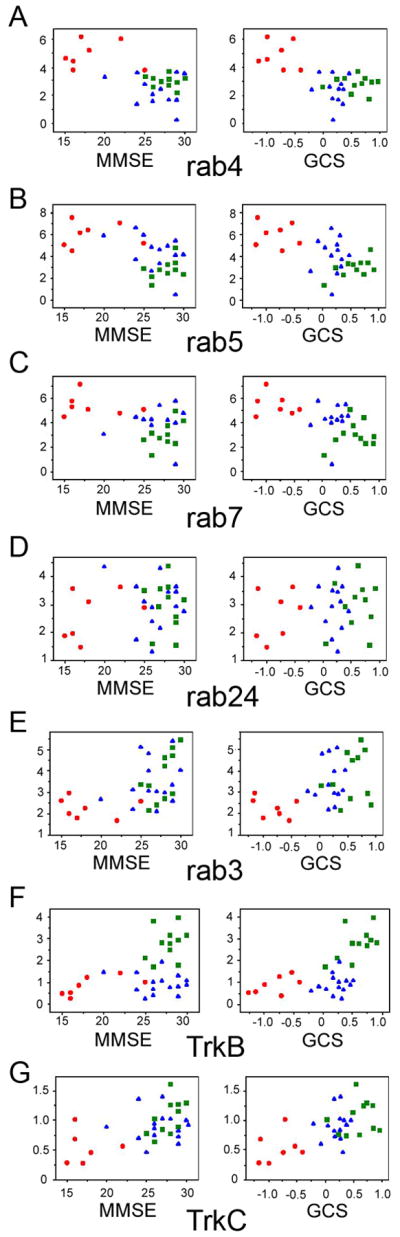
Association between select rab GTPase and neurotrophin receptor gene expression levels within CA1 neurons and antemortem cognitive measures in the same subjects. Scatterplots illustrate the relationship of gene expression levels and MMSE (left panel) and GCS scores (right panel) from individuals classified as NCI (green squares), MCI (blue triangles), and AD (red circles).
A. A highly significant negative association exists with rab4 and MMSE (p < 0.0001) and GCS performance (p < 0.0002).
B. A highly significant negative association exists with rab5 and MMSE (p < 0.001) and GCS performance (p < 0.001).
C. A significant negative association exists with rab7 and MMSE (p < 0.01) and GCS performance (p < 0.001).
D. rab24 expression levels are inversely correlated with MMSE (p < 0.0004) and GCS (p < 0.0002) scores.
E. A significant association between rab3 gene expression down regulation and poor MMSE (p < 0.002) and GCS (p < 0.005) performance was observed.
F. Down regulation of TrkB expression correlated with MMSE (p < 0.02) and GCS (p < 0.0001) performance.
G. Down regulation of TrkC expression correlated with MMSE (p < 0.003) and GCS (p < 0.0004) performance.