
Figure 5.
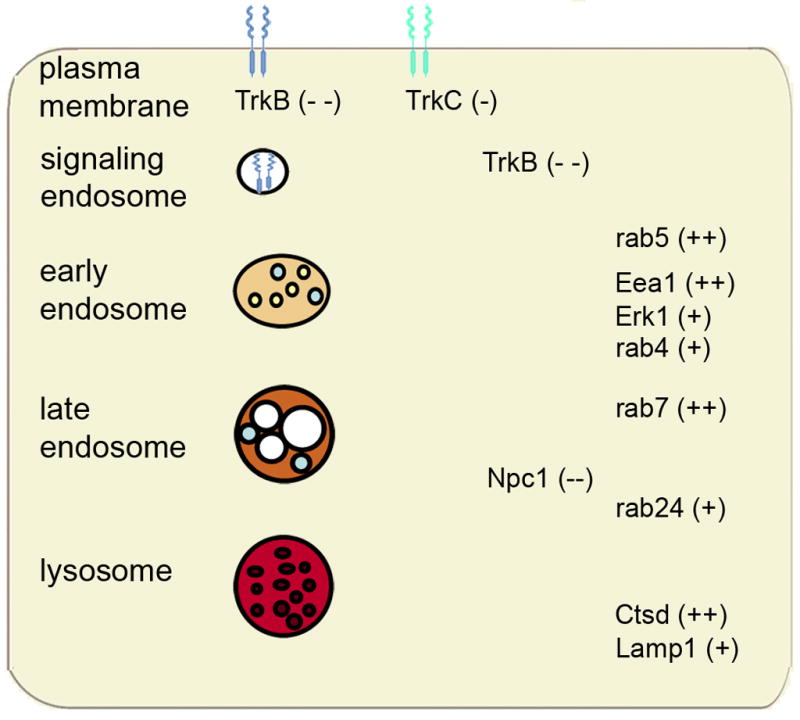
Schematic diagram illustrating gene expression level changes within components of the endosomal-lysosomal system and neurotrophins at the cell surface and within signaling endosomes of vulnerable CA1 pyramidal neurons in MCI and AD. Genes demonstrating up regulation are denoted with a plus sign (one plus sign for ‘late’ changes observed only in AD and two plus signs indicating ‘early’ up regulation seen in MCI and AD). Genes demonstrating down regulation are denoted with a minus sign (one minus sign for ‘late’ changes observed only in AD and two minus signs indicating ‘early’ up regulation seen in MCI and AD).