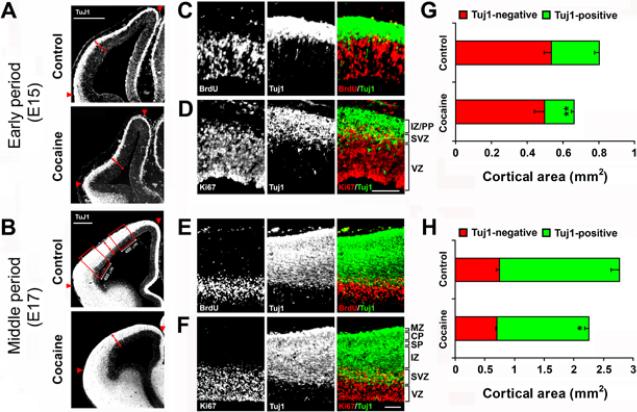
Fig. 2.
Effects of cocaine on the composition of the developing neocortex. (A, B) Immunostaining for Tuj1 in the fetal cortex of control and cocaine-exposed embryos at E15 (early period of neocortical neurogenesis) and E17 (middle period of neocortical neurogenesis) shows boundaries marking Tuj1-positive and Tuj1-negative areas (red arrows). The neocortical area between the red arrowheads was used for quantification. The boxed areas (400 μm in width) at E17 of the control group (B) were used for quantification of the densities of Tuj1-, glutamate-, and GABA-positive cells in the neocortex. Scale bar is 400 μm. (C, E) Co-immunostaining of BrdU (red) and Tuj1 (green) in the control neocortex at E15 (C) and E17 (E) show that the Tuj1-negative area essentially corresponds to the VZ. (D, F) Co-immunostaining for Ki67 (red) and Tuj1 (green) in the control neocortex at E15 (D) and E17 (F) shows that the area of overlap of Ki67 and Tuj1 staining corresponds to the SVZ, and the Tuj1-positive area is composed of the SVZ, IZ and other outer laminae of the neocortex (PP at E15 and SP/CP/MZ at E17). Scale bar = 100 μm for C-F. VZ, ventricular zone; SVZ, subventricular zone; IZ, intermediate zone; PP, preplate; SP, subplate; CP, cortical plate; MZ, marginal zone. (G, H) The Tuj1-negative neocortical area (red) was not changed by cocaine exposure, but the Tuj1-positive area (green) was significantly decreased, so that the change in the Tuj1-positive area accounted for the overall reduction in total neocortical area (red and green together) seen in cocaine-exposed fetuses, for both the early and middle periods of neocortical neurogenesis. *p<0.05, **p<0.01 compared to control, n = 6–7 per group from three individual pregnant dams.

