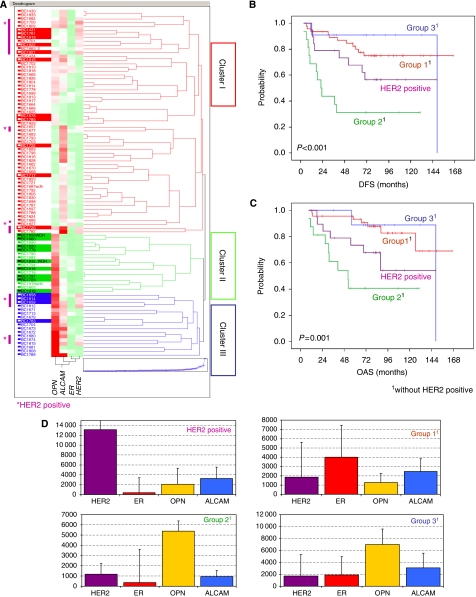
Figure 2.
Cohort A (training cohort) hierarchical cluster analysis based on OPN (SPP1), ALCAM, ER (ESR1) and HER2 mRNA expression levels (A), revealing three main clusters (I–III). In the coloured map, gene expression levels ranged from low (green), to moderate (white), to high (red). Cases with recurrences during follow-up are highlighted with coloured horizontal bars on the left. Tumours with high HER2 expression are marked on the left margin of the graph (purple bars). Based on clusters I–III and after separating HER2-positive cases, four groups (groups 1–3 and the HER2-positive group) were identified (D) (median values and s.d are given). (B) and (C) show Kaplan–Meier curves for DFS and OAS of the four groups, with group 2 being the ‘high-risk’ group characterised by ER/HER negativity, high OPN and low ALCAM mRNA expression.

