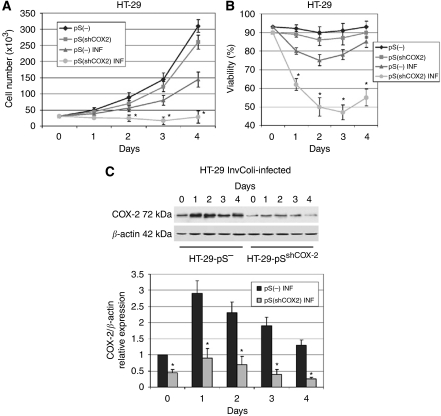
Figure 7.
HT-29 cell survival after bacterial infection depends on COX-2 overexpression. (A) Cell number, (B) cell viability and (C) COX-2 protein expression were evaluated in HT-29pS(−) and HT-29pS(shCOX−2) cells infected with InvColi-pS− (MOI 1:100), in comparison with control cells (not infected). See the ‘Materials and Methods’ section for details on cell lines. (⧫) HT-29pS(−) cells, transduced with pS(−) negative control vector; (▪) HT-29pS(shCOX−2) cells, transduced with pS(shCOX−2) vector and stably silenced for COX-2 protein; (▴): HT-29pS(−) INF cells, transduced with pS(−) negative control vector and infected with InvColi-pS−; (•): HT-29pS(shCOX−2) INF cells, transduced with pS(shCOX−2) vector and infected with InvColi-pS−. Viability was detected using the Trypan Blue exclusion assay and quantified as ((number of unstained cells)/(number of total cells)) × 100. COX-2 protein expression was evaluated by western blot and normalised against β-actin protein. COX-2 relative expression refers to not infected HT-29pS(−) sample, day 0. Data represent mean±s.e.m. of three independent experiments. *P<0.01.

