
Figure 4.
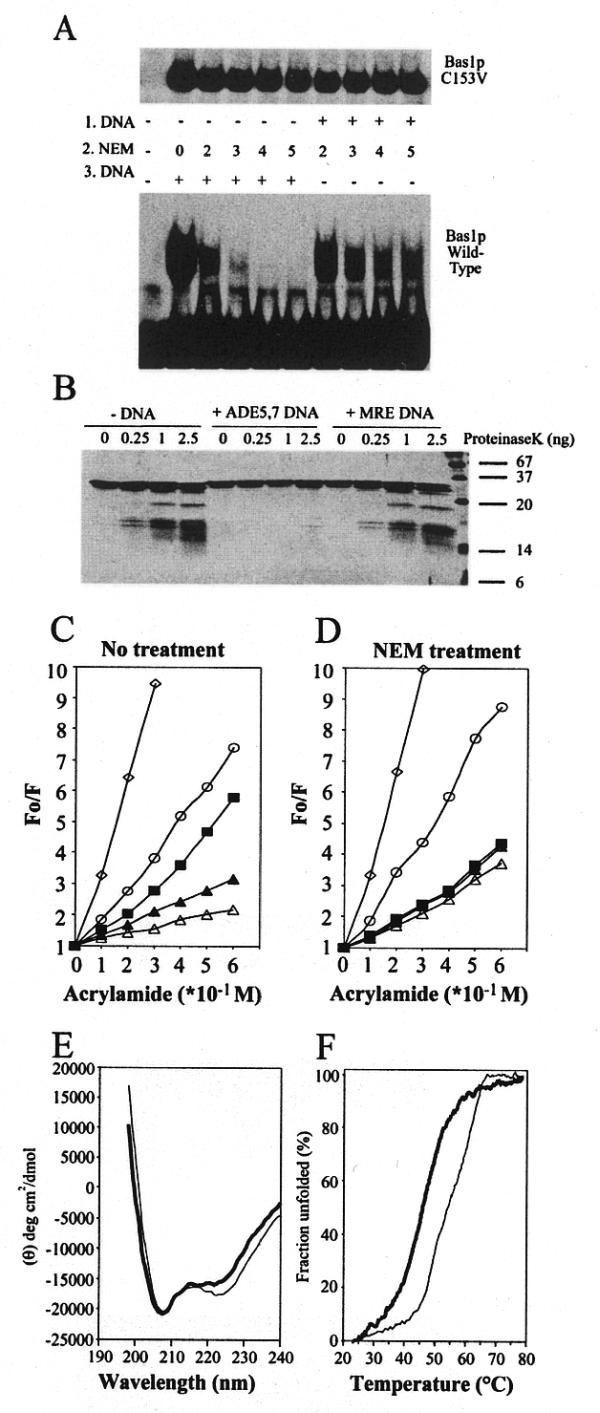
A DNA-induced conformational change in Bas1p. (A) Sensitivity of wild-type Bas1p and the C153A mutant to alkylation by NEM. (Lower) Two microlitres (0.5 µg protein) of purified wild-type GST–HA–Bas1p were incubated for 15 min at room temperature with increasing concentrations of NEM either before (1.DNA, left of pannel) or after (3.DNA, right) incubation with 100 fmol radiolabelled ADE5,7 promoter probe. Samples were then analysed by EMSA as in Figure 2B. (Upper) As above but carried out with the GST–HA–Bas1p C153V mutant. (B) Partial digestion of Bas1p, either free or complexed to DNA, with proteinase K. Bas1p[1–272] (0.25 µg) free (–DNA), in complex with ADE5,7 DNA (+ADE5,7 DNA) or in complex with unrelated DNA (+MRE DNA) was treated with increasing amounts of proteinase K. Proteins were then separated by 17.5% SDS–PAGE and revealed by silver staining. (C and D) Fluorescence quenching by acrylamide of free and DNA-bound Bas1p. The fluorescence emission of 2 µM Bas1p was quenched by successive addition of acrylamide to Bas1p treated (D) or not (C) with 5 mM NEM. In each condition fluorescence was measured at the wavelength corresponding to the emission maximum for Bas1p and the results are presented as the ratio between the unquenched fluorescence (Fo) and the fluorescence measured after acrylamide addition (F). Results correspond to the average of between six and nine independent measurements. Inter-assay variation was found to be <15 %. Closed square, Free Bas1p; open triangle, Bas1p bound to ADE5,7 specific DNA; closed triangle, Bas1p bound to unrelated DNA; open circle, Bas1p denatured for 60 min in 6 M guanidinium chloride; open diamond, 10 µM free tryptophan solution used as a reference. (E) CD spectrum of Bas1p[1–272] either alone (thick line) or in complex with specific DNA (ADE5,7 DNA, thin line). The protein concentration was 0.15 mg/ml in phosphate buffer and equimolar concentrations of DNA were added. The α-helical contents of Bas1p[1–272] alone and in complex with specific DNA were calculated as described in Materials and Methods and found to be 40 and 45%, respectively. (F) Thermal denaturation curves of Bas1p[1–272] either alone (thick line) or in complex with specific DNA (thin line). The apparent fraction of folded protein, obtained by monitoring the CD value at 222 nm, is shown as a function of temperature.