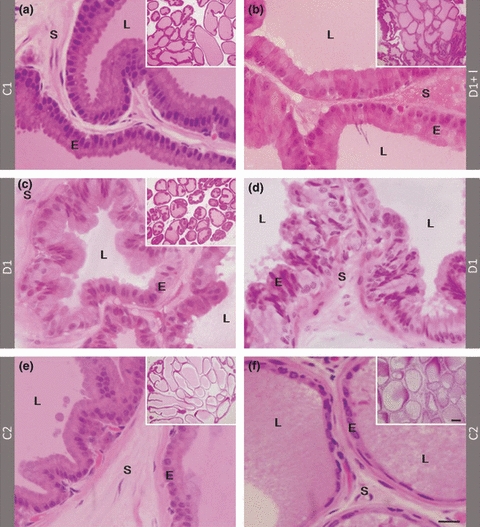
Figure 1.

Histological sections in historresin stained with H&E showing general aspect (small images) and details of acinar epithelium (large images) of the ventral prostate in control, C1 (a) and C2 (e), 1 week diabetic insulin-treated (b), 1 week diabetic without treatment (c and d) and 3 months diabetic rats (f). In control groups, the acinar epithelium shows columnar luminal cells and large luminal area (a, e). After 1 week of diabetes, there is a slight reduction in epithelial height (c) and intense acinar disorganization in some glandular regions (d). In medium-term diabetic group, epithelial cells appear cubic or flattened, indicating the intense epithelial atrophy (f). Arrows: areas of Golgi complex. E: Prostatic acinar epithelium; L: acinar lumen; S: Stroma. Scale bars are the same for all small and large images in the figure: 100 and 20 μm respectively.
