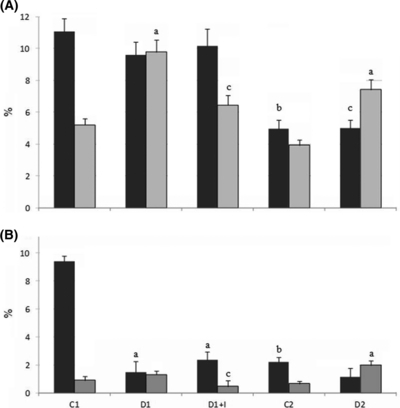
Figure 4.

(A) Relative frequency (%) of immunoreactions for androgen receptor (black bars) and p63-positive cells (grey bars). (B) Relative frequency (%) of immunoreactions for cell proliferation (black bars) and apoptotic cells (grey bars). (a) Significantly different from respective control, (b) Significantly different between ages, (c) Significantly different from short-term diabetic group (D1). P < 0.05.
