
Figure 1.
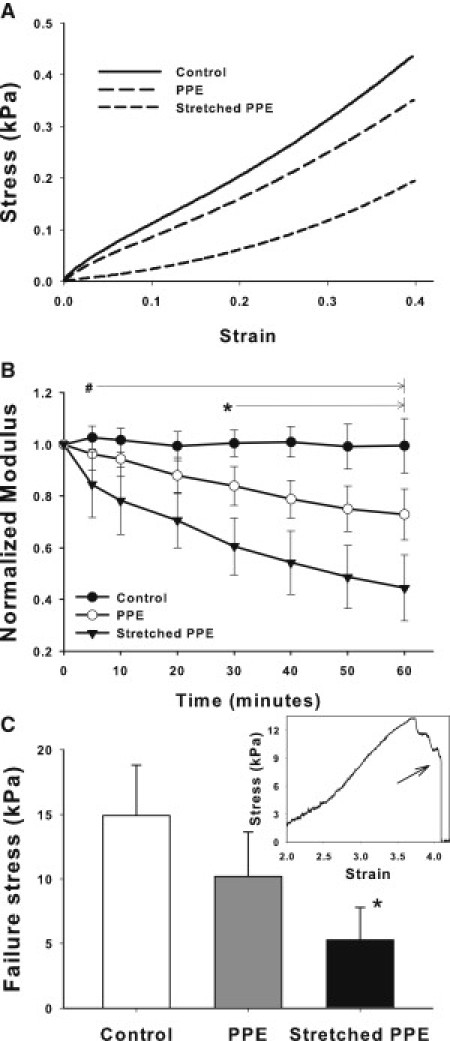
(A) Representative stress-strain curves obtained in normal mouse lung tissue before treatment (control) and after 1 hour of porcine pancreatic elastase (PPE) digestion in the absence or presence of static 40% uniaxial stretch. (B) Means and SDs of the normalized modulus Yn as a function of time for control, PPE, and stretched PPE conditions. # denotes a statistically significant difference between the stretched PPE group and the other conditions. ∗ denotes a statistically significant difference between the PPE and the control groups. (C) Failure stress measured at the end of 1 h protocol for the three groups. ∗ denotes a statistically significant difference between the stretched PPE and the control groups. The inset shows an example failure stress-strain curve and the arrow indicates the failure stress.