
Figure 3.
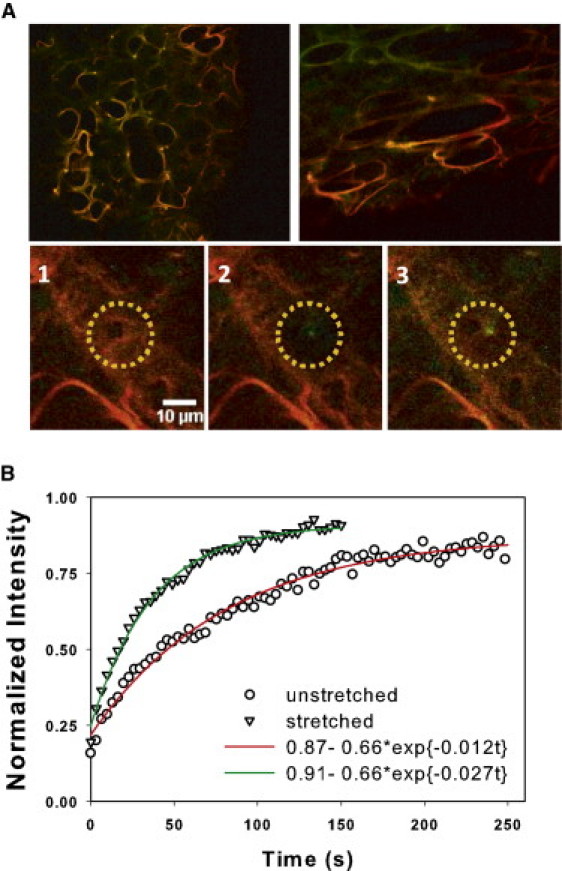
(A) Top row shows a control sample (left) after equilibration and a stretched sample (right) before full equilibration with f-PPE. For the stretched sample, strain is in the horizontal direction. (Green) Autofluorescence; (red) f-PPE signal. (Bottom row) Three images of a region before FRAP (left), after photobleaching (middle), and after near full recovery (right). (B) Example of normalized FRAP curves from a relaxed (circles) and a stretched (triangles) alveolar wall. The fluorescent intensity was normalized to 1 at time 0 corresponding to the average intensity of the bleached region (yellow circle) on the left panel in A. (Solid lines) Single exponential model fits.