
Figure 4.
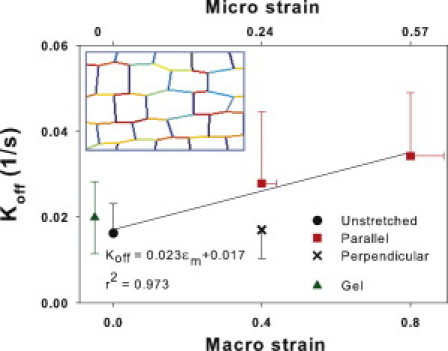
Means and SDs of estimated dissociation rates, koff, as a function of uniaxial macroscopic strain ɛm (bottom x axis) in unstretched samples (solid circle) and at ɛm of 0.4 and 0.8 (squares) measured on walls that had a direction parallel to macroscopic strain. At em = 0.4, koff was also measured along walls that were perpendicular to the macroscopic strain (cross). Inset shows a region of a nonlinear elastic network at em = 0.4 that was used to predict the average microscopic strain ɛμ (top horizontal axis) on the walls parallel to macroscopic strain. The shades (colors in the Supporting Material) represent local microscopic strain darker (red) denoting higher strains. Note the large variability among horizontal segments. The SD of ɛμ is plotted as horizontal error bars. The solid line shows the linear regression. The mean and SD of koff measured in pure elastin hydrogel is also shown (triangle).