
Figure 6.
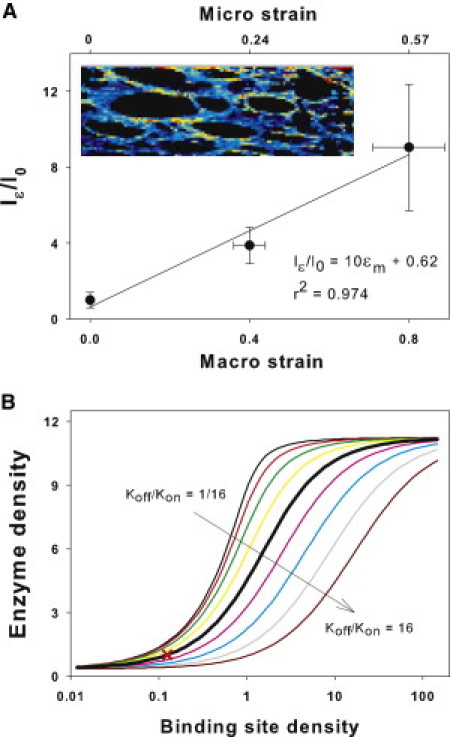
(A) Fluorescent intensity on alveolar walls parallel to macroscopic strain (Iɛ) normalized to mean intensity in the unstretched samples (I0) as a function of macroscopic and microscopic strains, as described in Fig. 3's legend. (Inset) Zoom into an alveolar region with brighter shades (shown in colors in the Supporting Material) representing high f-PPE intensity normalized by the autofluorescent intensity. The shades (colors) demonstrate a strong anisotropy as well as heterogeneity in labeling along parallel wall segments. (B) Sensitivity of model-based total enzyme concentration on a fiber, as a surrogate for fluorescent intensity, to variations in binding site density B0 for a range of binding on rates kon based on Eq. 4. (Thick black line) Baseline model for which B0 = 1/8 corresponds to unit enzyme concentration (cross).