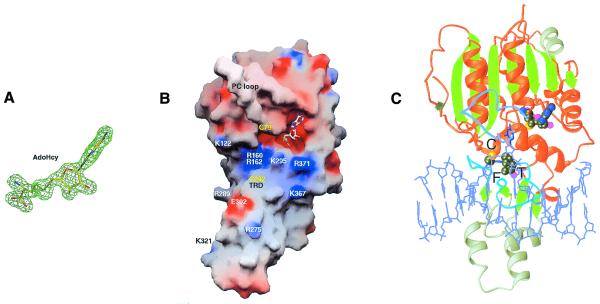
Figure 4.
(A) AdoHcy is shown in stick form and is superimposed on a Fo – Fc omit electron density map. (B) Solvent-accessible molecular GRASP surface (30) of the electrostatic potential of DNMT2Δ47. The surface is colored blue for positive (10 kT), red for negative (–10 kT) and white for neutral, where k is the Boltzmann constant and T is the temperature. (C) Model of DNMT2Δ47–AdoHcy bound to DNA. The DNA model is from the structure of the M.HhaI–AdoHcy–DNA complex (pdb 3MHT; 31).

