
Figure 2.
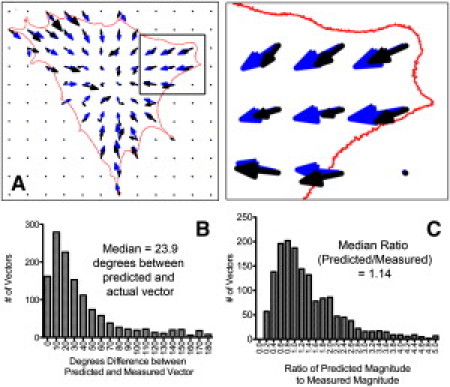
(A) Prediction of traction force vectors. An overlay of predicted (blue) and measured (black) traction forces demonstrates the model performance. Cell outline is shown in red. (B) Histogram of directional difference between predicted and measured vectors. (C) Histogram of the ratio between predicted and measured magnitude.